Five-minute charging needs the right cell and the right battery charging profile
The limit that stops fast charging is the one you cannot measure.
Five-minute charging only works when two things fit: a cell designed for it and the right battery charging profile, the current over time within five limits. The anode potential cannot be measured in a finished cell. A Batemo Cell Model computes it, so you get the fastest fast charging strategy for your chosen risk, ready for your BMS.
Talk to a battery engineer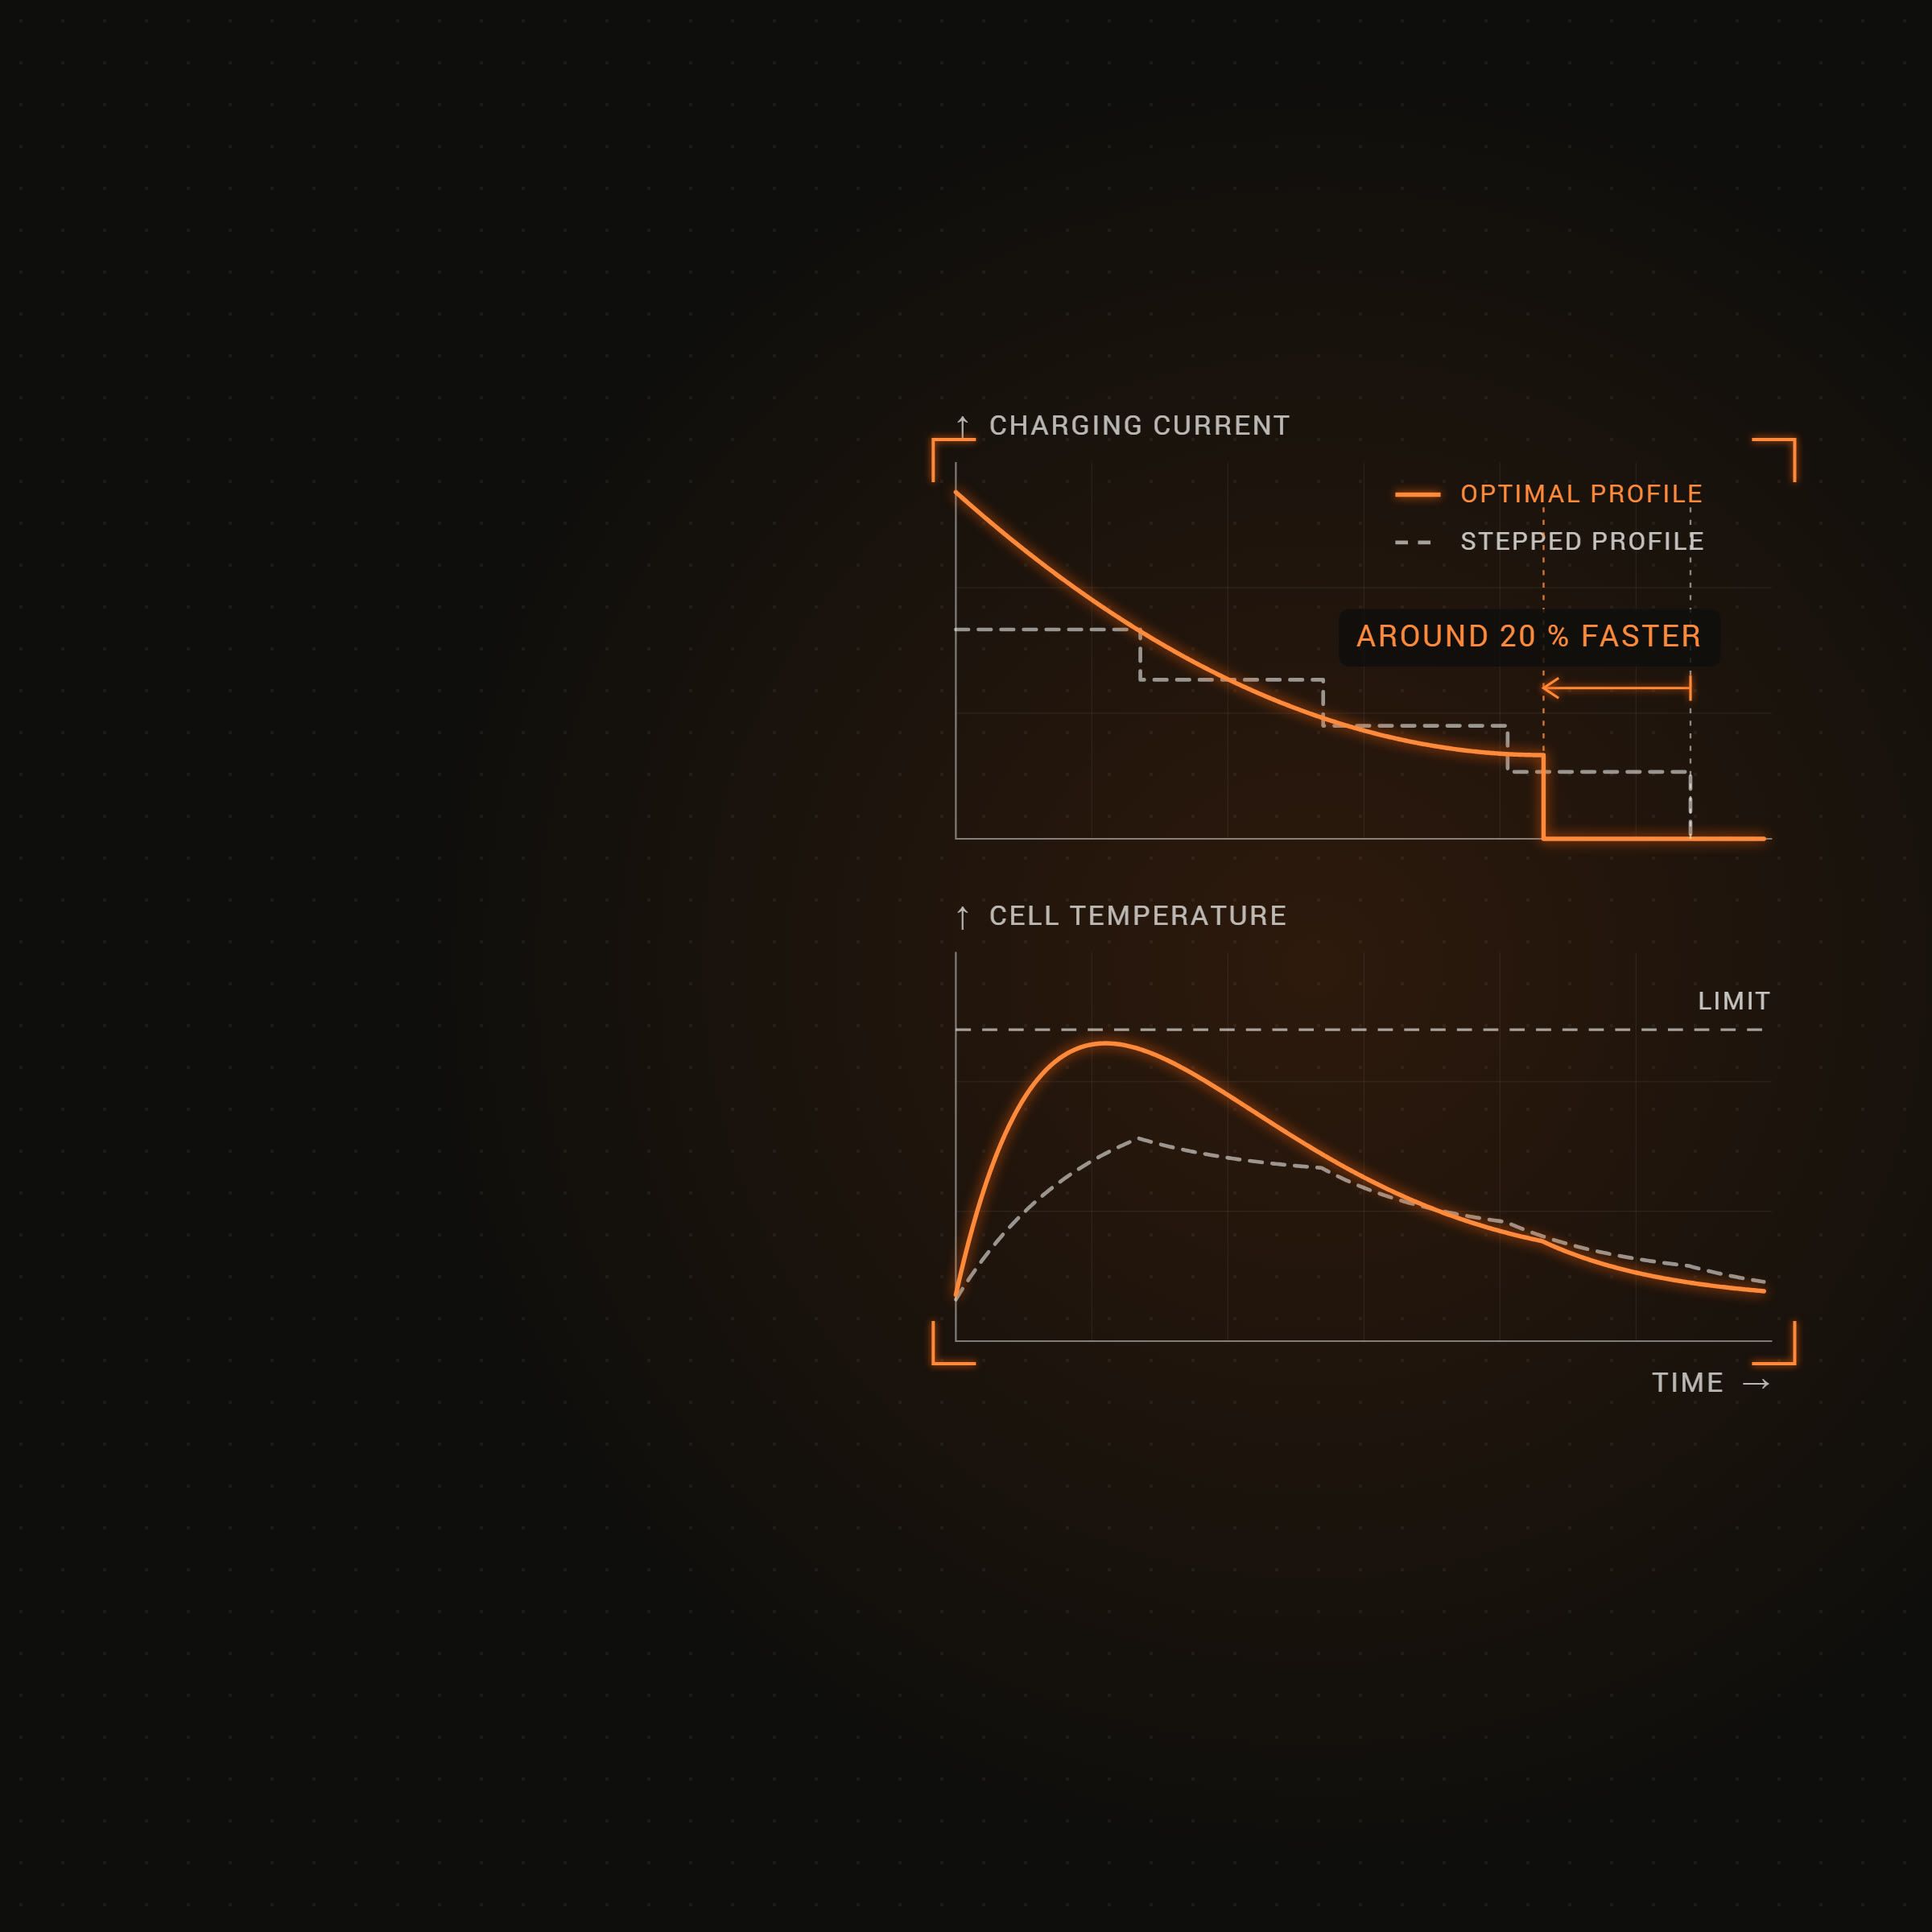
Developing a battery charging profile: today and with Batemo
Today, a fast charging profile is found by raising the current step by step and cycling cells for months. With a Batemo Cell Model the anode limit is computed, and you get the fastest charging strategy for the risk you accept, ready to implement in your BMS.

Today
Guess the anode limit.
The anode surface potential cannot be measured in a finished cell. Either it stays unknown, or it is measured with a reference electrode in an experimental setup that differs from the final cell, and the error carries over.
With a Batemo Cell Model
Compute the anode limit.
The Batemo Cell Model calculates the anode surface potential and gives you all five limits of fast charging at the same time.
You gain: The limitcharge at the physical limit, for the risk you choose
Today
Step the current up.
Each round tests a higher current, then the cells cycle for months before aging shows whether it was too much.
With a Batemo Cell Model
Control the anode potential.
Batch simulations derive the profile that controls the anode surface potential and avoids lithium plating, for every temperature, state of charge and aging state. The result is a charging strategy you implement directly in your BMS.
You gain: No platingby design, ready for your BMS
Today
Settle for a stepped profile.
Trial and error never reaches the optimum: even an optimal stepped profile stays about 20 % behind it on a current 4680 cylindrical cell.
With a Batemo Cell Model
Shape the optimal profile.
The optimal profile does not have to be stepped. It can follow any curve the limits allow, and the charging time drops by around 20 %, as far as cell and system allow.
You gain: Fastercharging, typically around 20 % shorter
Today
Spend months per round.
In one example project, four rounds of trial and error took about seven months and tested eight profiles.
With a Batemo Cell Model
Get a validated profile sooner.
With the cell model generation included, the profiles were ready and experimentally validated within about three months.
You gain: 7 to 3months to a validated profile, in one example project
Today
Pay for every test round.
In the same example, personnel and measurement cost added up to about 90 k€ for a small cylindrical cell.
With a Batemo Cell Model
Test smarter, not harder.
Software, personnel and validation measurements stayed below 30 k€. Development cost dropped by around 60 %.
You gain: Lower costunder 30 k€ instead of about 90 k€, same example
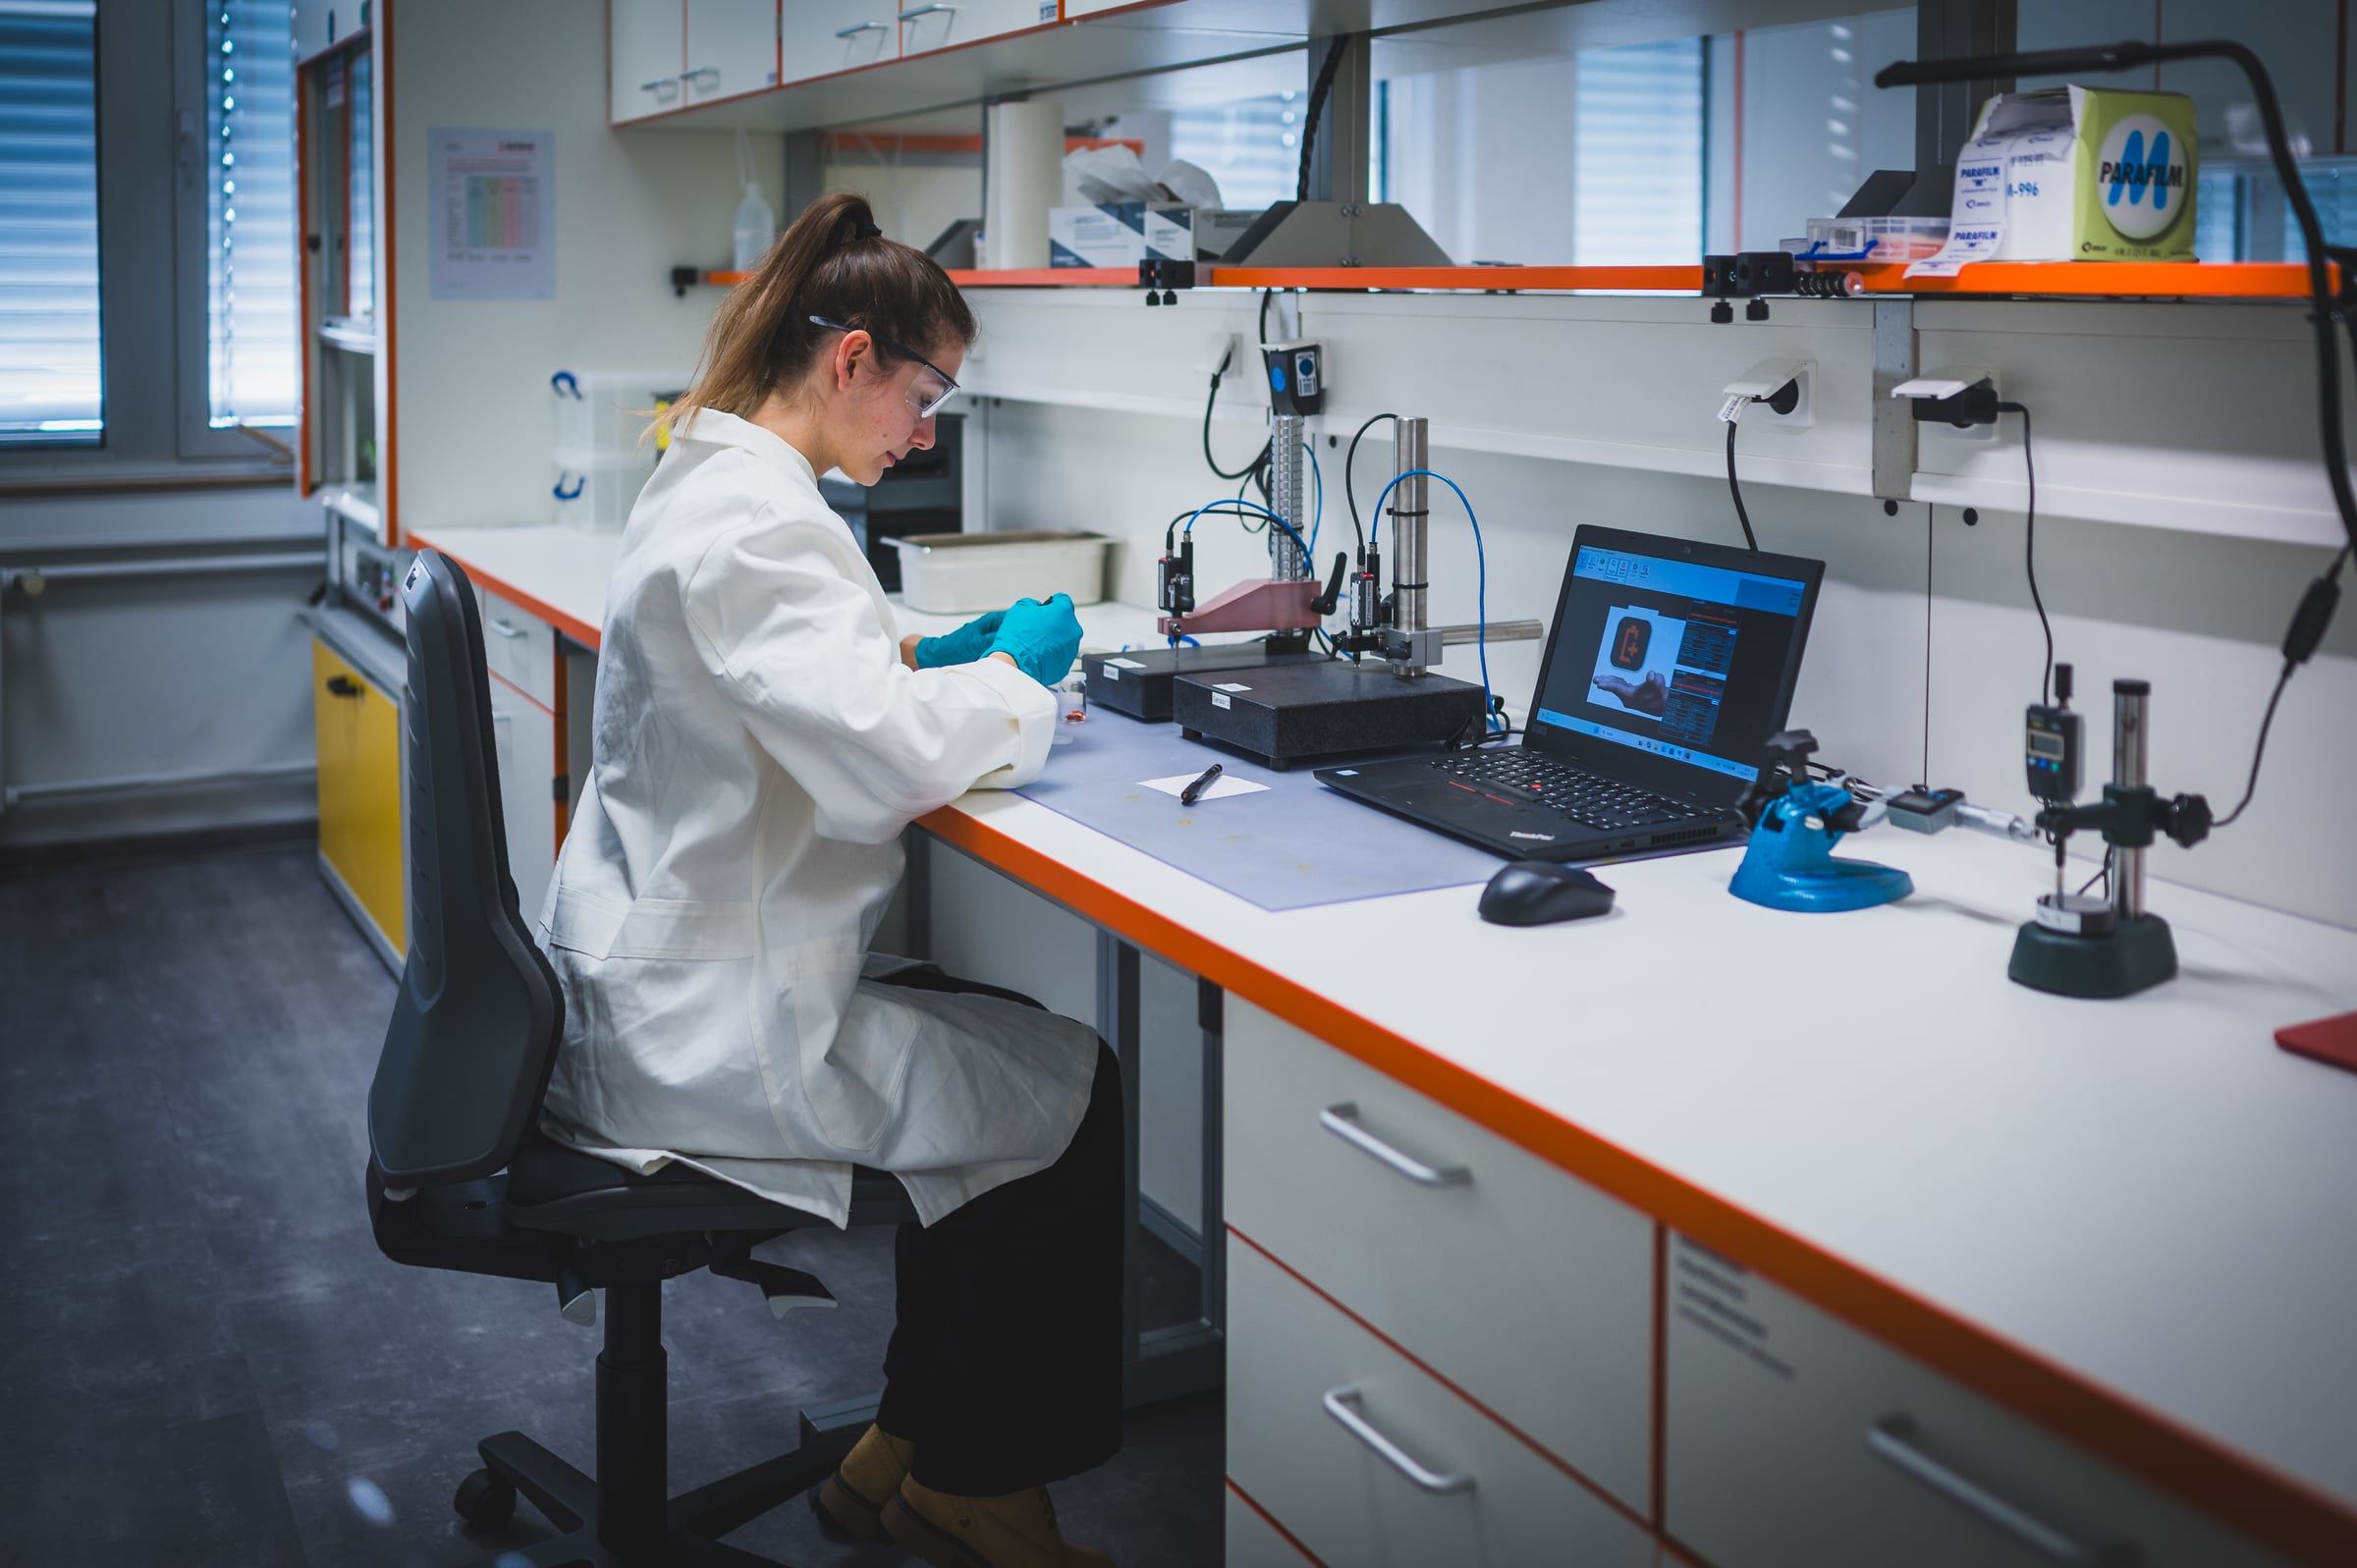
Every test round starts at the bench
Cells, fixtures and thermocouples are prepared by hand, then the cells cycle for weeks. A computed anode limit saves most of these rounds.
How long does your cell actually take to charge?
Four of the five limits on charging current are measurable. The fifth — the potential at the anode surface — is not, and it is usually the one that binds. This is what happens when you can compute it instead.
↑ charge current
CC-CV · stepped · constant power · boost
time →
How charging heat is carried away from the cell.
Computed at -20, 0, 25, 40, 50 °C; blended between.
Power cells charge faster, energy cells store more.
How this is calculated
The charging times come from a grid of simulations our engineers ran: three cell designs, three cooling concepts, five ambient temperatures, both charging strategies. Your setting is read off that grid — first between the two neighboring cell designs, then between the two neighboring temperatures. Outside the grid nothing is extrapolated; the edge value stands. Each simulation stops after 11 hours: where the charging current falls below 0.1C before the cell is charged, the time shows as over 660 min, and any setting blended from such a point counts as not reached. At a few points the anode-potential profile is slower than CCCV, because it keeps the anode above the plating limit the whole way. The power density follows the cell design on the same scale.
Questions about battery charging profiles
What is a battery charging profile?
A battery charging profile defines the charging current over time, usually over a state-of-charge window at a given temperature. It can be constant current followed by constant voltage, stepped, or controlled by a physical limit. The profile decides how fast a cell charges and how much it ages while doing so. The best profile changes as the cell ages, and it depends nonlinearly on temperature, cooling method and starting state of charge. That is what makes it so difficult, and why simulation-based approaches are used to master it methodically.
What limits fast charging?
Five boundaries: power from the grid, current of the charger, cell temperature, cell voltage and the anode. The first two come from the system, the next two from temperature-induced and voltage-induced aging of the cell. The fifth is lithium plating at the anode. Violating a cell limit accelerates aging or creates a safety risk.
What is lithium plating, and why does the anode potential matter?
If the potential at the anode surface drops below zero against lithium, metallic lithium plates onto the anode. Although the process is partially reversible, capacity is permanently lost and a safety problem can grow. The anode surface potential is therefore an important limit in fast charging. No sensor reaches the anode surface in a finished cell, so the limit has to be computed.
How do I find the fastest charging profile without months of cycling?
Use a parameterized and validated physics-based cell model, integrate it into your module model and run batch simulations that keep the charging current within all five limits. A deliberately small set of validation experiments then confirms the result. In one example project, the validated profile was ready in about three months instead of seven.
How much faster is a computed profile than a stepped one?
In a documented example on a current 4680 cylindrical cell, an optimal stepped profile stays about 20 % behind the physical optimum. Stepping the current up by trial and error never reaches the optimum, because it cannot see all five limits and optimize for all of them.
How accurate is the model behind the profile?
Across 198 validated cells the median deviation of the Batemo Cell Model is 0.8 %, measured against validation experiments. Batemo backs its models with a guarantee: if you can show us another battery cell model that is more accurate, we will refund your money. We publish the accuracy of every model on its own cell page on this website, and for every model we provide Excel reports that show its accuracy under the validation conditions in detail. Batemo also has further ways to verify how accurately the anode potential is simulated.
Two ways to a faster charging profile
If you need the decision
Bring us the charging time you have to reach.
An engineer who has measured these cells reads your message — not a mailbox, and not a sales desk that forwards it.
If you need the data
See the measured cells before you model one.
Batemo Insights holds the measured behavior behind every cell in the Batemo Cell Explorer — including what the public Explorer deliberately does not show.
Or start with the measurements — explore the public Batemo Cell Explorer →